
The Museum Turns 5 Years Old, Part 2: Site Statistics
I love charts and graphs. So let's see how I did this year on the various statistics I track for the site...
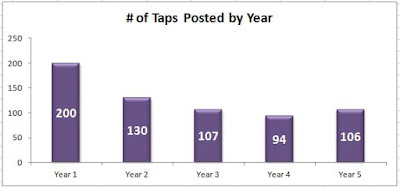
First is the total number of tap profiles written, from the end of last year's anniversary post until now:
The second chart is of the number of initial profiles written for breweries/brewpubs/restaurants:

The third chart shows the number of taps acquired by the museum per year:


First is the total number of tap profiles written, from the end of last year's anniversary post until now:

Analysis: I reversed the downward trend! If I hadn't have had such a lousy September/October, this year would have approached Year Two's totals. I fell shy of Year Four's number of tap profiles by a single profile.
The second chart is of the number of initial profiles written for breweries/brewpubs/restaurants:

This is important to track, because initial profiles require much more work to research and do a write-up on. Again I reversed the downward trend and wrote more initial profiles than I did in Year Four, but fell short of other previous years.
The third chart shows the number of taps acquired by the museum per year:

Well, I really hit it out of the park here, so to speak! It was a record year for acquisitions as you can clearly see in the graph. It leaves me a bit shy of 1000 taps in total, which I will probably reach by the end of the year. After that who knows what will happen?
The final chart is probably my favorite chart, because it is the most rewarding. It shows site traffic and lets me know whether or not people are visiting the site:

Site traffic is up 4.4% this year. I'm really happy with this number and the continuing trend of increased traffic every year. It's not unrealistic to think that in 2-3 years the site could be approaching a million page views. It blows my mind!
Thanks for indulging my love of charts and your continuing support of the site. Part Three of the anniversary posts will cover individual tap statistics.
Comments
Post a Comment